How to Reduce Logistics Shipping Costs in 2026?
Reducing logistics shipping costs in 2026 will require more than negotiating cheaper freight rates. It will demand clearer data, disciplined planning, and practical control across every shipment. Fuel prices, labor shortages, port congestion, and customer expectations continue to reshape logistics shipping. A small mistake in carton dimensions can increase dimensional weight charges. An avoidable delivery attempt can quietly damage margins.
James B. Rice Jr., a respected supply chain resilience researcher at MIT, has explained, “Resilience is the ability to cope with unexpected events.” That principle matters for cost control. Companies need backup carriers, flexible routing, and realistic delivery promises. They also need shipment-level visibility, not attractive dashboards that nobody checks. Measure cost per order, accessorial fees, empty miles, damage rates, and delivery performance each month. Then question the results.
Small changes can matter.
Consolidating two daily shipments may reduce handling and fuel costs. Better packaging can lower volumetric weight without increasing damage. Regional warehouses may shorten final-mile distances, although they can also add inventory expenses. This trade-off deserves honest review. Not every technology investment will pay back quickly. Some automation projects fail because teams automate poor processes. That is uncomfortable, but useful to admit.
This guide examines carrier contracts, packaging, route design, inventory placement, and data quality. It focuses on actions that logistics managers can test, measure, and improve. Results will differ by product, geography, and service promise. Reliable savings come from evidence, not fashionable claims.
Baseline Costs: Transport Exceeds 60% of U.S. Logistics Spend (CSCMP)
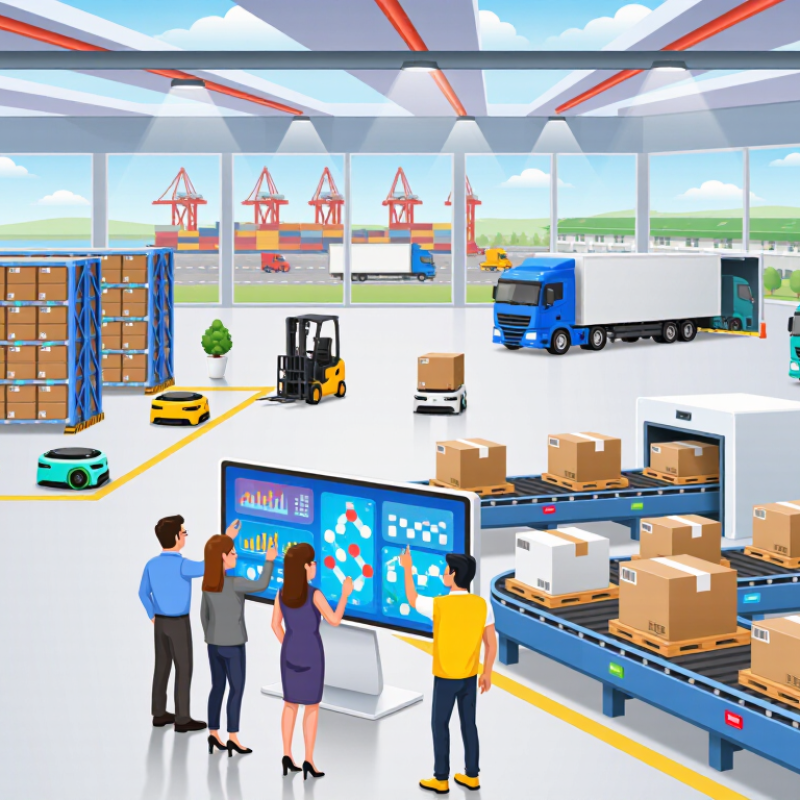
Transport deserves the first review. CSCMP benchmarking shows it exceeds 60% of U.S. logistics spending. That ratio changes the savings conversation. A small routing improvement can outweigh many packaging tweaks. In practice, teams should measure cost per delivered order, not only freight invoices. Include fuel, accessorial charges, detention, returns, and failed delivery attempts. Hidden charges accumulate quietly.
Start with lane-level data. Compare planned miles with actual miles, cube utilization, stop density, and delivery windows. A half-empty truck leaving every afternoon signals a scheduling problem. Consolidating orders by region may reduce trips, but it can lengthen customer wait times. That trade-off needs testing. Use weekly dashboards and investigate unusual invoices within seven days. Contract terms should define surcharge formulas, appointment rules, and claims procedures clearly. Reliable records support better negotiations and audit trails. Do not chase the lowest quoted rate. It may create higher damage or redelivery costs.
Operational discipline matters too. Load pallets by route sequence, verify addresses before dispatch, and train staff to scan exceptions immediately. Near-real-time shipment visibility helps managers react before detention bills appear. Yet technology is not a cure. Poor data can automate poor decisions. I would also question the 60% baseline. Each network has different distances, products, and service promises. Test changes in one lane first, measure delivered cost for four weeks, then expand carefully. Savings should survive busy seasons, not only look good in a spreadsheet.

Lower logistics shipping costs in 2026 by treating empty miles as a planning problem, not just a carrier problem. A commonly cited ATRI benchmark places empty travel near 20% of total miles. Your own number may differ. Measure loaded and empty miles by lane, customer, equipment type, and delivery window. A simple weekly dashboard can reveal a truck returning empty after a morning delivery.
Consolidate compatible loads before dispatch. Match nearby pickups with return routes, then combine smaller shipments when delivery timing allows. Keep weight, dimensions, temperature, and handling requirements visible. One practical rule helps: avoid creating a second trip when one truck has safe capacity remaining. Better planning reduces fuel use, driver hours, and unnecessary vehicle wear.
Tips: Build a 48-hour consolidation review. Flag shipments within 100 miles of existing routes. Offer realistic delivery windows instead of narrow appointment times. Check the route after every exception. The first plan will probably be wrong. Review missed matches, late pickups, and rejected combinations every week. Some empty miles remain necessary for repositioning, maintenance, or urgent capacity. Do not chase a lower percentage at the expense of service reliability. Managers should compare savings against detention, overtime, missed appointments, and customer complaints. A small pilot across two lanes can expose data gaps before wider implementation. Dispatchers also need authority to combine loads, because a perfect dashboard cannot fix slow decisions.
How to Reduce Logistics Shipping Costs in 2026?
Freight budgets often hide a large emissions opportunity: mode selection. U.S. EPA SmartWay data shows rail emits 75% less greenhouse gas per ton-mile than trucks. That difference can reduce fuel exposure on predictable, heavy lanes. Rail also moves one ton roughly 470 miles on one gallon, according to 2024 efficiency data from the Association of American Railroads. The number is impressive, but service details still matter.
Review six months of shipment records before changing modes. Compare line-haul rates, fuel surcharges, drayage, terminal fees, and inventory carrying costs. A practical test is a 500-mile lane with stable weekly volume. Move the long middle section by rail, then use trucks for pickup and final delivery. Keep safety stock near the receiving site. One missed rail connection can erase the expected savings.
The U.S. Department of Transportation’s Freight Facts and Figures reports that freight demand will continue growing, increasing pressure on road capacity and fuel budgets. Rail can absorb part of that pressure, especially for dense, non-urgent freight. However, the calculation is not perfect. Short lanes, remote terminals, and irregular orders may favor trucks. Measure cost per delivered ton, emissions per shipment, dwell time, and damage rates for ninety days. Then adjust the lane plan instead of trusting a single forecast.
| Cost-Reduction Dimension | Truck-Based Shipping | Rail-Based or Rail-Integrated Shipping | 2026 Planning Implication | Recommended KPI |
|---|---|---|---|---|
| Greenhouse-gas emissions per ton-mile | 100 index points Used as the truck baseline. |
25 index points Approximately 75% lower than the truck baseline. |
Evaluate rail for lanes where transit-time requirements allow mode shifting. | GHG emissions per ton-mile |
| Emissions avoided per 1,000 ton-miles | Baseline: 100 relative emissions units. | Approximately 75 relative units avoided compared with trucking. | Prioritize high-volume, long-distance freight for emissions and fuel-efficiency gains. | Relative emissions avoided per shipment |
| Best-fit shipment profile | Flexible for short distances, urgent deliveries, and direct door-to-door service. | Well suited to heavier, predictable, and longer-distance freight flows. | Segment freight by distance, weight, urgency, and shipment frequency before selecting a mode. | Percentage of eligible freight shifted to rail |
| Line-haul cost exposure | More exposed to road fuel prices, driver availability, congestion, and highway capacity. | Generally less dependent on road fuel consumption for the long-haul segment, but rail rates vary by lane and service. | Compare total landed cost rather than the quoted line-haul rate alone. | Total cost per ton-mile |
| Fuel-cost sensitivity | Fuel is a direct operating-cost component and may also affect fuel surcharges. | Energy use per ton-mile is typically lower than trucking, especially for heavy, long-distance movements. | Run fuel-price sensitivity scenarios when comparing modes for annual contracts. | Fuel cost as a percentage of transportation cost |
| Accessorial and handling costs | May include detention, waiting time, tolls, re-delivery, and appointment-related charges. | May include terminal handling, drayage, transloading, storage, and additional loading or unloading. | Include every origin, terminal, drayage, and destination charge in the mode comparison. | Accessorial cost per shipment |
| Equipment utilization | Partial loads and empty return miles can increase the effective cost per ton-mile. | High-capacity movements can improve cost efficiency when rail service and terminal access are available. | Consolidate compatible shipments and improve load planning before booking capacity. | Load factor and empty-mile percentage |
| Transit-time trade-off | Usually offers more direct routing and flexible delivery scheduling. | May require terminal transfers and additional planning, which can extend total transit time. | Use rail for replenishment freight while reserving trucks for urgent or time-critical orders. | On-time delivery rate and total transit time |
| Intermodal strategy | Truck-only service can simplify operations but may increase long-haul exposure to road costs. | Rail for the long-haul segment plus trucks for first- and last-mile delivery. | Use a route-by-route comparison of rail line-haul, drayage, terminal, and inventory costs. | Intermodal cost per shipment and rail share of line-haul miles |
| Inventory carrying cost | Shorter transit can reduce in-transit inventory, depending on the lane. | Longer or less predictable transit may require additional safety stock. | Calculate transportation savings together with inventory carrying costs and service-level impacts. | In-transit inventory value and safety-stock days |
| Procurement decision rule | Choose when speed, flexibility, direct delivery, or frequent smaller shipments is the priority. | Choose when shipment volume, distance, weight, and schedule stability support rail economics. | Approve mode changes only after comparing total cost, service performance, and emissions. | Total landed cost, service level, and GHG intensity |
In 2026, automated routing is becoming a practical way to reduce logistics shipping costs. Industry research estimates that AI-assisted planning can lower transport expenses by 5–15%. The result depends on data quality, delivery density, and operational discipline.
A routing system can compare fuel prices, vehicle capacity, traffic patterns, driver hours, and delivery windows within seconds. It may also combine nearby orders and reduce empty return miles. A dispatcher can then review the suggested routes before releasing them. This human checkpoint matters when weather changes or a customer requests a late adjustment.
Start with one region and a small group of vehicles. Track cost per delivery, mileage, idle time, missed windows, and route changes. Compare four weeks of automated planning with a similar manual period. Small details matter. A ten-minute loading delay can distort an entire route.
The first model will be wrong. That is normal. Poor addresses, outdated road restrictions, and unrealistic delivery promises can produce inefficient recommendations. Teams should correct these errors weekly and record why routes were changed. Clear audit trails improve reliability and help managers challenge questionable decisions.
A 5–15% saving is not guaranteed. It may be lower during low-volume periods or difficult weather. Yet consistent testing can reveal where automation creates measurable value. Better routing also gives planners more time to manage exceptions instead of rebuilding schedules manually.
How to Reduce Logistics Shipping Costs in 2026?
Diesel can represent 20–30% of trucking costs, according to the American Trucking Associations. That exposure can quickly erase a narrow shipping margin. A practical cost review should track fuel by route, vehicle, load, and delivery window. A 600-mile trip with long loading delays may consume more fuel than expected. Those small losses accumulate.
Fuel planning must connect operations with contracts. Update fuel surcharges using a clear, documented index. Review them regularly. Route planners should reduce empty miles, steep detours, and unnecessary idling. Driver coaching also matters. Smooth acceleration, correct tire pressure, and early maintenance checks can lower consumption. Results vary. Traffic and weather remain difficult to predict.
Tips: Measure idle time weekly, not quarterly. Compare planned and actual fuel usage after every major route change. Set practical targets, but avoid forcing unsafe driving behavior. A short stop can cost less than an engine running for forty-five minutes. Consolidating loads may reduce trips, although tighter schedules can create delays. This trade-off deserves review. Fuel savings are never automatic. Teams must test one change, record the result, and adjust the plan when evidence disagrees.
Control fuel exposure: diesel typically represents 20–30% of total trucking costs.
Fuel exposure can materially affect freight budgets. At the midpoint of the benchmark range, a 25% diesel share means that reducing fuel consumption, improving route efficiency, and using fuel-cost adjustments can influence approximately one-quarter of trucking costs.