How to Track Your Shipping Logistics in 2026?

How to Track Your Shipping Logistics in 2026?

In 2026, logistics shipping tracking is no longer limited to checking a carrier’s website. It connects warehouse scans, GPS signals, IoT sensors, and delivery updates in one operational view. A shipment may leave Shenzhen at dawn, pass through Singapore, and reach Rotterdam before the customer sees an accurate status. That gap still causes costly confusion.

MIT supply-chain expert Yossi Sheffi describes resilience as “the ability to bounce back from a disruption.” His point matters because tracking should support decisions, not merely display moving icons. A reliable system compares planned routes with live data. It flags a missed port connection, a temperature change, or an unexpected delivery delay. Managers can then contact the carrier before a customer complains.

The strongest approach begins with clean shipment data. Record the purchase order, container number, carrier, estimated arrival time, and delivery location. Connect these records with APIs where possible. Then assign clear ownership for every exception. Someone must review the alert. Someone must act on it.

Do not trust every ETA.

Weather, congestion, inaccurate scans, and weak network coverage can distort predictions. A dashboard may look impressive while hiding incomplete data. I have seen teams monitor dozens of shipments but miss one delayed pallet because the status remained unchanged. That is an uncomfortable weakness.

This guide explains practical tracking methods for 2026. It also examines data quality, carrier communication, predictive alerts, and human review. The goal is simple: create visibility that improves delivery performance, rather than technology that merely creates more screens.
How to Track Your Shipping Logistics in 2026?

Map Every Shipment Across Modes—UNCTAD: Ships Carry Over 80% of Trade

How to Track Your Shipping Logistics in 2026?

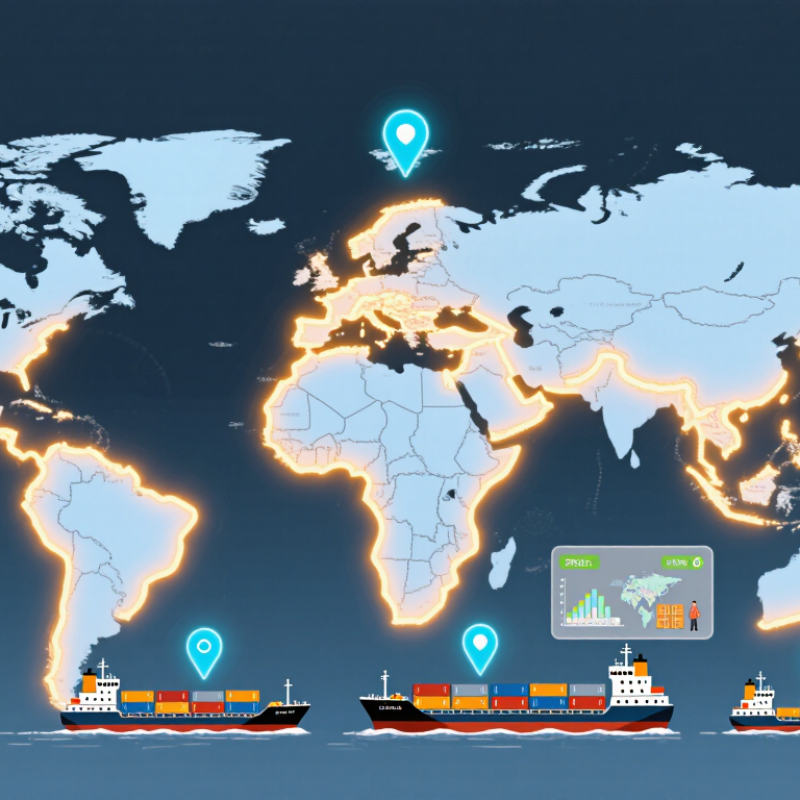
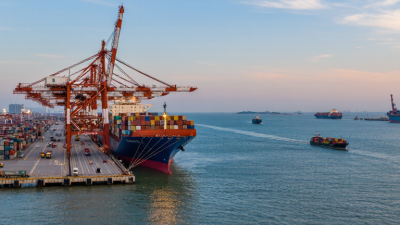
Maritime transport remains the backbone of global commerce. UNCTAD’s Review of Maritime Transport 2024 states that ships carry over 80% of world trade by volume. That figure changes how logistics teams should track freight. A container crossing an ocean may appear calm, yet port queues, weather, and customs checks can quickly alter delivery plans.

Use one shipment record across every mode. Record the container number, vessel departure, port arrival, rail handoff, and final-mile scan. Add timestamps, not vague status labels. The World Bank’s Logistics Performance Index 2023 evaluates tracking and tracing as a core logistics capability across 139 economies. It also shows that supply-chain visibility remains uneven, especially when cargo crosses borders and transport systems.

Small gaps matter.

In 2026, connect vessel data with port, rail, road, and warehouse updates. A map should show the shipment’s last confirmed location, planned route, and estimated arrival. It should also flag missing events. I have found that a delayed scan often creates more confusion than a delayed truck. That assumption needs testing, because some systems report updates late rather than losing cargo. WTO’s Global Trade Outlook and Statistics projects merchandise trade volume growth of 3.3% in 2025, increasing pressure on already busy networks. Better tracking will not remove disruption. It can make the uncertainty visible sooner.

How to Track Your Shipping Logistics in 2026?

Map every shipment across modes: ships carry more than 80% of global trade by volume.

Global seaborne trade reached approximately 12.3 billion tonnes in 2023, after a 2.4% year-on-year increase. The chart shows annual trade volume and the corresponding growth rate, providing a baseline for shipment planning across sea, rail, road, and air logistics networks.

Source: UNCTAD, Review of Maritime Transport 2024. Seaborne trade figures are rounded to the nearest 0.01 billion tonnes.

Standardize Tracking Events with GS1 EPCIS 2.0 for Shared Visibility

In 2026, shipping visibility depends less on more dashboards and more on shared event language. EPCIS 2.0 gives trading partners a common structure for describing what happened, when, where, and why. A carton scanned at 09:42 becomes a precise event, not a vague status such as “in transit.” Teams can record receiving, packing, loading, shipping, and delivery events. They can also attach sensor observations, including temperature and shock readings.

A reliable implementation starts at the warehouse floor. Define event ownership before connecting systems. Agree on identifiers for products, cases, shipments, locations, and equipment. Map each scan to business steps and dispositions. EPCIS 2.0 supports structured queries, JSON-LD data, and richer sensor information. This helps carriers, warehouses, and consignees view the same shipment history. Access controls still matter. Shared visibility should not mean unrestricted visibility.

Operational experience exposes weak points. A missing scan can break an otherwise elegant chain. Clock differences can also distort sequence. Teams should validate timestamps, reject incomplete events, and monitor duplicate identifiers. Not every sensor reading deserves immediate action. Some data needs context. A practical team reviews exceptions weekly and improves capture rules gradually. The model may be standard, but local processes remain imperfect. That is where careful governance earns trust.

Capture GPS, IoT, and Scan Data—MHI Reports 56% Sensor Adoption

How to Track Your Shipping Logistics in 2026?

Shipping visibility now depends on connected evidence, not occasional status updates. MHI’s Annual Industry Report reports 56% sensor adoption across supply chain operations. That figure signals a practical shift toward measurable logistics. GPS can record a vehicle’s route and dwell time. IoT sensors can capture temperature, humidity, shock, and door openings. Scan data can confirm handoffs at warehouses, terminals, and delivery points. Together, these signals create a time-stamped shipment history.

The details matter. A GPS ping every fifteen minutes may miss a short unauthorized stop. A barcode scan can prove custody, but not cargo condition. Teams should compare sensor readings with scan events and planned routes. A sudden temperature rise beside a delayed scan deserves immediate review. MHI’s finding is useful, yet adoption does not guarantee reliable data. That gap matters. Devices may lose power, networks may fail, and workers may skip scans during busy loading periods.

Maritime tracking also deserves attention. The United Nations Conference on Trade and Development states that more than 80% of global merchandise trade by volume moves by sea. Delays can therefore begin far from the final customer. In 2026, logistics teams should store GPS, IoT, and scan data in one searchable timeline. Access controls and clear retention rules improve trust. I would also measure missing events, not only successful deliveries. That uncomfortable metric often reveals where the process needs redesign.

Predict ETAs with AI—MHI Projects Adoption Rising to 73% by 2028

Shipping logistics in 2026 will depend increasingly on predictive visibility. The MHI Annual Industry Report 2024 projects artificial intelligence adoption to rise from 14% to 73% by 2028. That shift could change ETA management from reacting to delays into preparing for them.

A useful system combines carrier updates, port congestion, weather, customs milestones, and warehouse scans. AI models can compare these signals against historical transit patterns. For example, a container leaving Singapore with a delayed berth may receive a revised ETA before the vessel departs. Operations teams can then adjust labor, inventory transfers, and customer notices.

The numbers still require caution. The World Bank’s Logistics Performance Index 2023 shows that tracking and tracing remains uneven across countries, especially during international handoffs. Missing scans can weaken an otherwise advanced prediction. Human review matters.

Keep the data clean.

In practice, logistics managers should measure ETA accuracy by lane, carrier, and transport mode. A prediction that is accurate for 90% of regional shipments may fail on cross-border routes. Teams should record every prediction, the actual arrival time, and the reason for variance. This creates an auditable learning loop, not a black box. AI may identify patterns quickly, but poor timestamps and inconsistent milestones can produce confident mistakes. That uncomfortable gap deserves regular testing.

How to Track Your Shipping Logistics in 2026? — Predict ETAs with AI

Industry adoption outlook: AI-supported logistics and ETA prediction is projected to reach 73% by 2028.

Tracking Dimension Operational Data Used 2026 Application ETA Impact Recommended Control
Shipment milestone events Booking, pickup, departure, transshipment, arrival, customs release, delivery Create a single event timeline across road, rail, ocean and air movements High — reduces visibility gaps between handoffs Standardize event names, timestamps and exception codes
Location and telematics GPS position, geofences, vehicle status, container location and route progress Compare actual movement with the planned route and detect deviations High — identifies slowdowns before a missed appointment Use geofence alerts for origin, border, terminal and destination points
Historical transit performance Lane, mode, weekday, season, dwell time and previous delay history Train machine-learning models to calculate a dynamic ETA instead of using a fixed schedule High — accounts for recurring lane-level variability Keep planned and actual timestamps for every completed movement
Port, terminal and border dwell Queue time, loading time, discharge time, inspection status and release time Separate travel time from handling and clearance time in the ETA calculation Medium–High — highlights non-moving time Monitor dwell-time thresholds by facility and transport mode
Weather and disruption signals Severe weather, road closures, flooding, storms, strikes and infrastructure outages Add external risk signals to the ETA model and trigger exception workflows Medium–High — supports earlier re-routing and customer alerts Use confidence bands instead of presenting one exact arrival time
Customs and document status Document completeness, declaration status, inspection requests and release events Predict clearance risk and prevent avoidable holds before arrival Medium — reduces administrative delay uncertainty Set mandatory document checks before cargo handoff
AI ETA confidence Predicted arrival time, prediction interval, last update, data age and exception reason Show operations teams whether an ETA is stable, uncertain or deteriorating High — improves decision quality and communication Recalculate after material events and display the reason for each change
Exception management Delay severity, affected orders, customer priority, available capacity and recovery options Rank disruptions by business impact and recommend corrective actions High — converts tracking data into action Define escalation rules for late, at-risk and critical shipments
Adoption outlook Industry research projection for organizations using AI in supply-chain operations AI-assisted ETA prediction is expected to become a mainstream logistics capability 73% by 2028 Start with one lane, validate prediction accuracy and expand by exception type
Measurement note: Track ETA accuracy with mean absolute error, on-time delivery rate, milestone completeness, dwell time and the percentage of shipments requiring manual intervention.

Measure OTIF, Cost, and Carbon—ISO 14083 Standardizes Freight Emissions

How to Track Your Shipping Logistics in 2026?

Reliable logistics tracking now needs more than delivery status. Teams should measure OTIF, total freight cost, and emissions together. IEA’s Transport 2023 report estimates that road freight produced about 2.4 gigatonnes of CO2 in 2022. That figure makes carbon data operational, not decorative.

ISO 14083 provides a consistent method for calculating and reporting greenhouse gas emissions across transport chains. It helps companies compare road, rail, air, and sea movements using clearer activity data. Record shipment weight, distance, fuel type, vehicle class, and empty-mile performance. Then connect those inputs with delivery results and invoices.

A shipment may arrive on time while carrying excessive cost or carbon. That is a real logistics failure, even when the dashboard looks green.

Tips: Set one monthly scorecard. Track OTIF, cost per tonne-kilometre, and kilograms of CO2e per shipment.

Keep supplier activity data, calculation boundaries, and emission factors visible for review. Use ISO 14083 methods consistently, but challenge weak assumptions.

Data is rarely perfect. It may contain estimated distances, missing fuel records, or inconsistent shipment weights. Flag those gaps instead of hiding them. Internal audits and periodic recalculation can improve reliability.

The hardest part is not the formula. It is maintaining disciplined data collection across every handoff.